

 English
 русский
 Português
 عربى
عربى فارسی
فارسیIndustry News

How Does Vibration Analysis Predict Bearing Failure
 May-29-2026
 Industry News
Predictive maintenance has fundamentally shifted how facilities manage rotating asset lifecycles. Rather than reacting to catastrophic seizures or scheduling arbitrary replacements, maintenance teams now leverage vibration technology to peer inside operating machinery without disassembly. The bearing—arguably the more failure-prone component in electrical motors and drives—exhibits distinct vibrational signatures throughout its degradation timeline. Understanding these patterns enables interventions weeks or months before functional failure, transforming unplanned downtime into scheduled maintenance windows.
The Four-Stage Failure Progression
Bearing degradation follows a predictable trajectory, each stage generating characteristic frequency components detectable through accelerometer-based monitoring:
Stage One: Subsurface Initiation Microscopic inclusions or stress concentrations beneath raceway surfaces trigger fatigue at 10,000–50,000 cycles below the surface. Vibration levels remain near baseline—typically <2 mm/sec RMS for general machinery per ISO 10816-3. No discernible spectral changes emerge; this stage demands ultrasonic or acoustic emission techniques for detection.
Stage Two: Surface Manifestation Fatigue cracks propagate to raceway surfaces, creating minute spalls or pits. Discrete impacts generate low-amplitude bursts at bearing defect frequencies:
BPFO (Ball Pass Frequency Outer): (N/2)×(1−d/D×cosφ)×RPM/60
BPFI (Ball Pass Frequency Inner): (N/2)×(1+d/D×cosφ)×RPM/60
BSF (Ball Spin Frequency): (D/2d)×[1−(d/D×cosφ)²]×RPM/60
FTF (Fundamental Train Frequency): (1/2)×(1−d/D×cosφ)×RPM/60
These frequencies appear in spectrum plots as narrow peaks 3–10 dB above background noise, often masked by rotational harmonics.
Stage Three: Mechanical Degradation Spalling expands across raceway segments, introducing broadband energy and modulation sidebands. PeakVue or enveloped acceleration techniques become essential—demodulating high-frequency resonant responses (typically 2–10 kHz structural natural frequencies) to isolate impact periodicity. Vibration velocity climbs to 4–7 mm/sec RMS; audible noise emerges.
Stage Four: Functional Collapse Cages fracture, balls skid, and raceways gall. Spectral energy becomes chaotic; broadband amplitudes exceed 10 mm/sec RMS. Immediate shutdown becomes imperative to prevent secondary damage to shafts, housings, or driven equipment.
Critical Analytical Techniques
| Method | Frequency Range | Primary Application | Equipment Cost |
| Velocity Spectrum | 2–1,000 Hz | Unbalance, misalignment, looseness | $2,000–5,000 |
| Acceleration Envelope | 500–10,000 Hz | Early bearing defects, gear mesh | $5,000–12,000 |
| PeakVue/Spike Energy | 1,000–20,000 Hz | Incipient rolling element faults | $8,000–20,000 |
| Phase Analysis | 1–200 Hz | Unbalance vs. misalignment discrimination | $3,000–7,000 |
Frequency Domain Interpretation
Effective diagnosis requires distinguishing bearing frequencies from common confounders:
Unbalance: 1× RPM, radial dominance, phase stability 90° apart horizontally
Misalignment: 2× RPM, axial vibration >50% of radial, 180° phase opposition across coupling
Looseness: 0.5× RPM subharmonics, non-integer multiples, directional variability
Electrical Fluting: Broadband 2–10 kHz without discrete BPFO/BPFI peaks (as detailed in our previous technical discussion)
Bearing defect frequencies calculate precisely from geometry, yet manufacturing tolerances introduce ±5% variation. Analysts should search ±2 bin widths around theoretical values, particularly for variable-speed electrical motors and drives where RPM fluctuation broadens spectral lines.
Vibration Monitoring Implementation
Sensor Placement
Radial: Within 75 mm of bearing load zone, perpendicular to shaft axis
Axial: Opposite drive end for thrust bearing assessment
Triaxial accelerometers: Capture orthogonal vectors simultaneously, critical for vibration technology systems with complex motion profiles
Data Collection Intervals
Monthly trending for general machinery (ISO 17359 Category II)
Weekly for high-speed or critical unspared equipment
Continuous for machines >1 MW or safety-critical applications
Alarm Thresholds
Warning: 1.5× baseline or ISO 10816 Zone B upper limit
Danger: 2.5× baseline or Zone C threshold
Trend rate: >20% increase between consecutive measurements warrants investigation
Practical Case Parameters
A 30 kW, 4-pole motor (1750 RPM) driving a material handling vibrator exhibits baseline vibration of 1.2 mm/sec RMS. Bearing geometry: 6314 deep groove ball bearing, pitch diameter D=125 mm, ball diameter d=19.05 mm, contact angle φ=0°, ball count N=8.
Calculated defect frequencies:
BPFO = 4.68× RPM/60 = 136.5 Hz
BPFI = 7.32× RPM/60 = 213.4 Hz
BSF = 2.03× RPM/60 = 59.2 Hz
Spectrum analysis at month six reveals BPFO peak at 138 Hz (1.8 mm/sec) with sidebands at ±29.2 Hz (shaft rotational frequency). Envelope demodulation confirms 136.4 Hz dominant peak at 0.45 gE. Replacement scheduled at month eight; disassembly reveals 12 mm spall segment on outer raceway—precisely matching predictive timeline.
Integration with Motor Systems
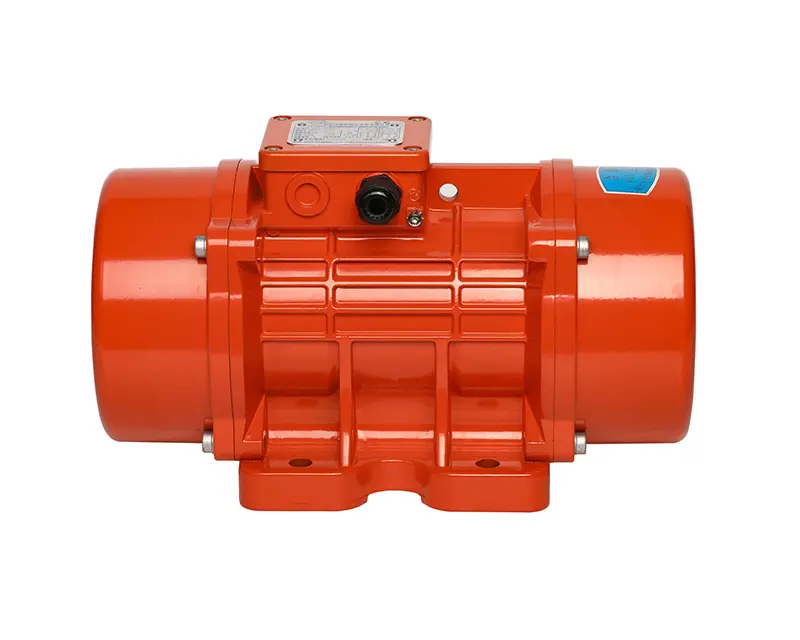
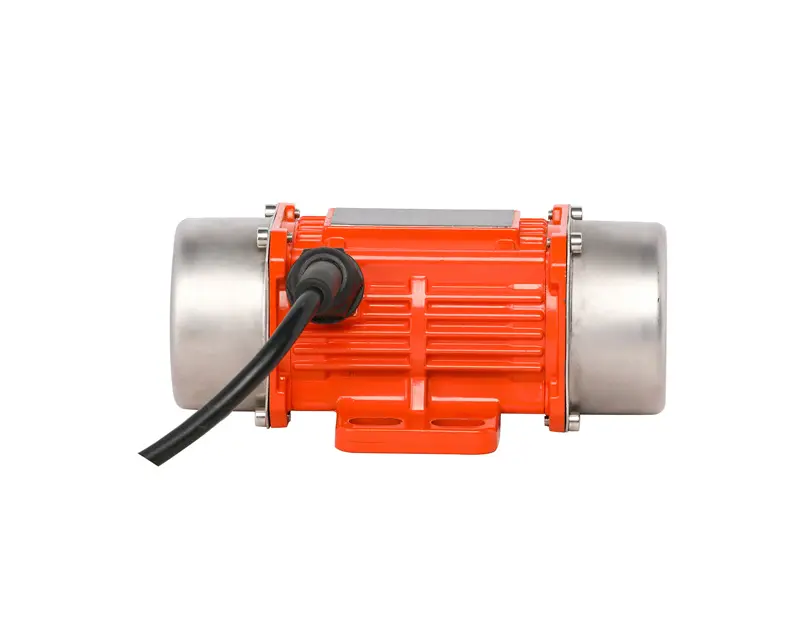
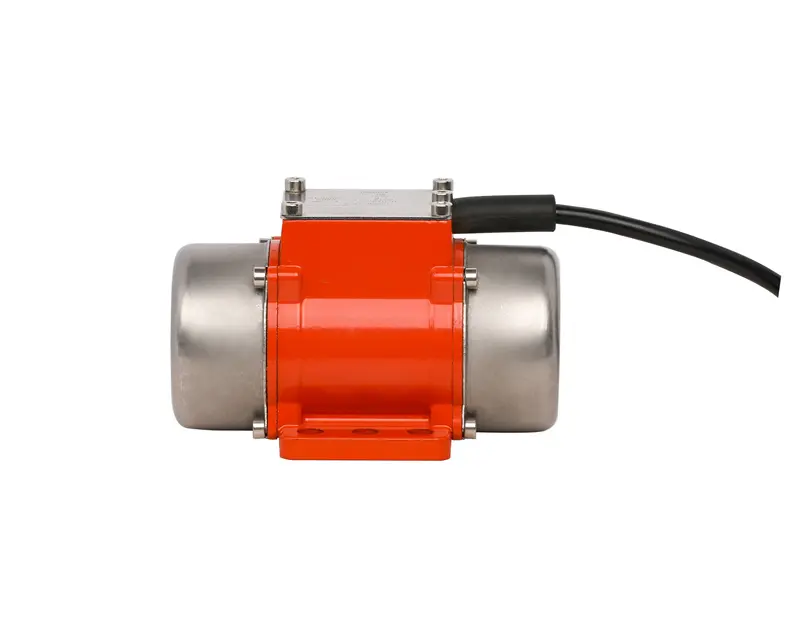
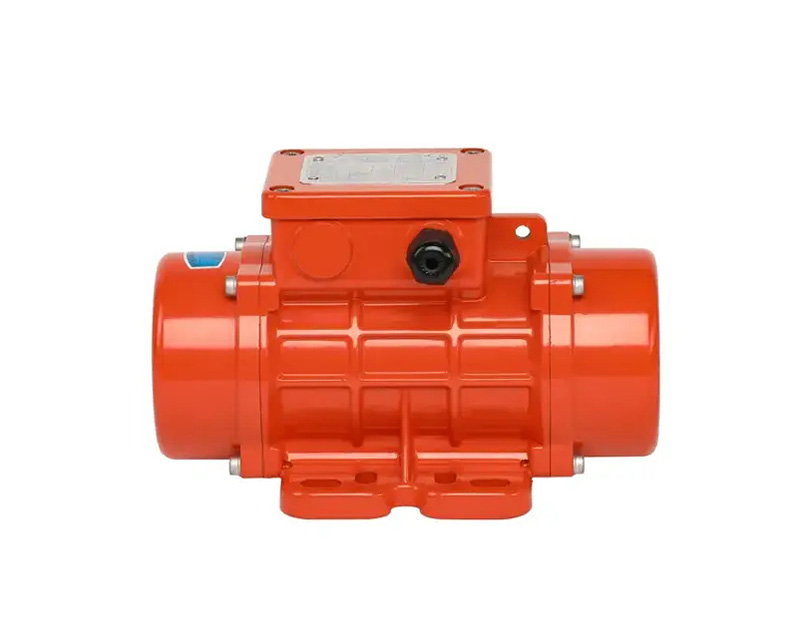
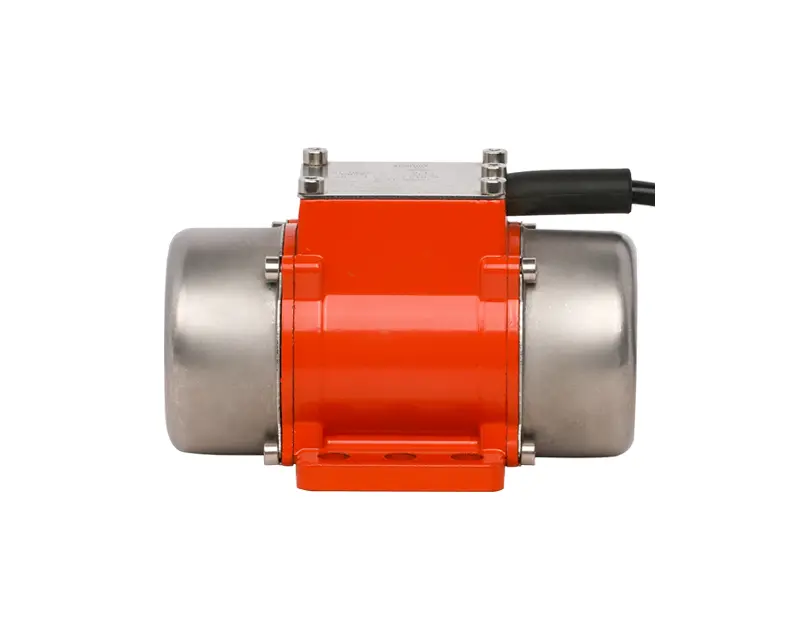
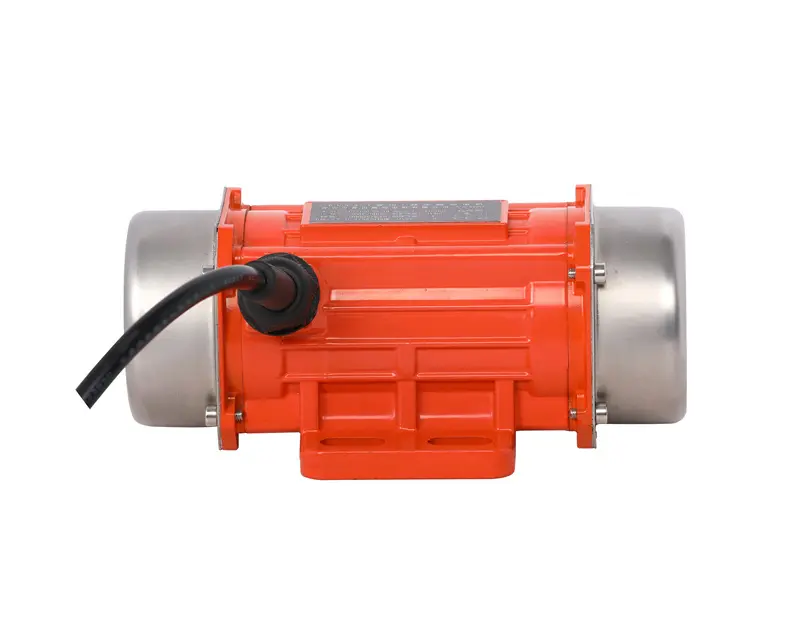
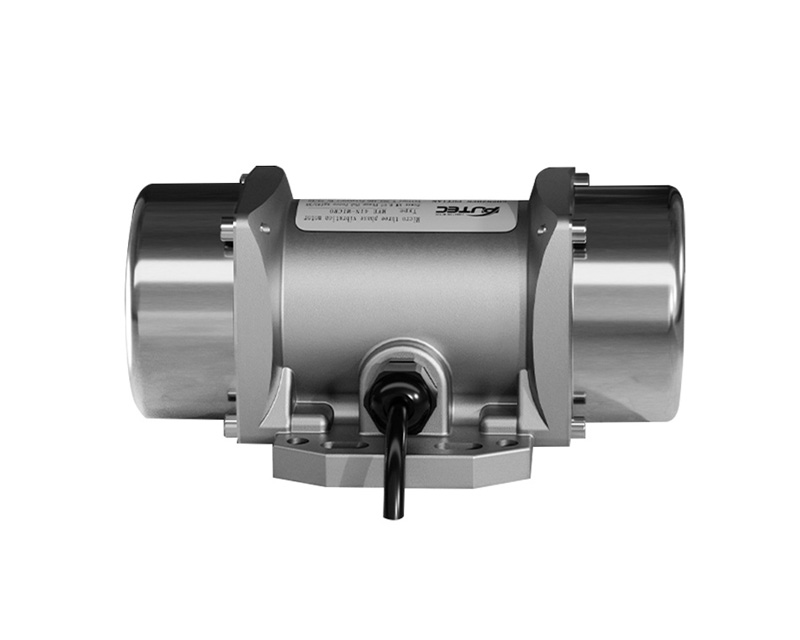
Modern electrical motors and drives increasingly embed vibration sensors at the manufacturing stage. Shenzhen Putian Vibration Motor Co., Ltd. offers PT-MVE series vibrators with optional IEPE accelerometer provisions, enabling direct integration with plant-wide condition monitoring architectures. Key specifications:
Sensitivity: 100 mV/g ±5%
Frequency response: 0.5–10,000 Hz ±3 dB
Temperature range: −40°C to +120°C
Protection: IP67 with stainless steel housing
Vibration analysis transforms bearing maintenance from reactive crisis management to quantitative science. The progression from subsurface fatigue to functional failure spans weeks to months—ample opportunity for intervention when vibration technology monitoring captures early spectral indicators. For operations dependent on continuous electrical motors and drives availability, systematic vibration trending delivers unmatched reliability economics: maintenance cost reduction of 25–30% and elimination of 70–80% unplanned mechanical failures.
Mobile
Products
Contact Us
- Address: No.6 Building, Wanfeng 98 Industrial City, Shajing Street, Baoan District, Shenzhen, Guangdong, China.
- Phone: +86-18923719730 / +86-0755-27460501
- Fax: +86-0755-27460606
- E-mail: [email protected]
Copyright © Shenzhen Putian Vibration Motor Co., Ltd. All Rights Reserved.

